|
|
|||||||||||||||||||||||||
|
|||||||||||||||||||||||||
|

Search
Scripts
NEW CGI Directory

News by JavaScriptSearch
Javascript Chart Plotting with PlotKit
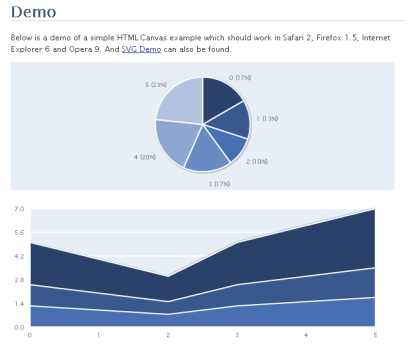
JavaScriptSearch Version 0.8 of the PlotKit Chart and Graph Plotting Library for Javascript has been released. It has support for HTML Canvas and also SVG via Adobe SVG Viewer and native browser support, maximizing compatibility accross browsers. Previously known as CanvasGraph.js, PlotKit is written by 26 year old UK programmer Alastair Tse. It is aimed at web applications that require plotting series of data in modern web browsers. Using the library requires Mochikit v1.3 or higher ( http://mochikit.com/ ). Here is how the author describes the idea behind PlotKit: "The motivation for this work is to allow simple graph plotting in Javascript without resorting to anything but your web browser. I'd like the library to be simple enough for someone who knows very little Javascript to be able to use, but extendable so that people who know what they're doing to make great looking graphs for their sites." The library is well documented and freely available for download at http://www.liquidx.net/plotkit/. PlotKit is licensed under the BSD License, so it can be included in either free or commercial applications.
PlotKit demonstrations. |
 NEWS BY MONTH
 EDITOR'S DESK
 SUBMIT NEWS

|
|
|
|
| Copyright © 1998 - 2018 DevStart, Inc. All Rights Reserved | ||